Clang! Powerful Memory Profiling for the iPhone
I’ll start by saying that Clang is a must-have tool for every iPhone developer. It’s easy to use, and it does a fantastic job of profiling the memory usage of your apps.
The iPhone is a powerful hand-held device, but the memory constraints are tight enough that they can cause serious problems with application performance. With 128 MB of memory on board, other applications running in the background, and a virtual memory model that does not include swap space, it’s easy to run out of memory and crash an app. Even though your iPhone has 8GB or 16GB of Flash storage, memory that your application allocates will not be swapped out to the disk to free up system memory. Since over-releasing objects will crash an application in difficult to understand ways, it can be tempting to be cautious about releasing objects. However, the system monitors memory usage, and shuts down any application that takes up too much memory. This is the cause of a great many application crashes on the iPhone. You can use around 30 MB safely for a sustained period of time. Get closer to 40 or 45 MB, and the system will very likely shut your app down with an exit status of 101.
In order to make sure you’re not leaking memory, it’s important to use memory profiling tools to catch leaks and inefficiencies in your code. The iPhone SDK ships with a handful of useful profiling applications in a package called “Insruments”. These programs allow you to watch memory and processor usage while your app is running on your iPhone. Some of the Instruments that are especially useful are Leaks, Object Allocations, and Memory Monitor. These are great tools, but they have some serious limitations. For instance, while Leaks and Object Allocations are fantastic for catching memory leaks, neither one will alert you to a leak of an image object, which seems kind of important. Who cares if you’ve leaked a 48 byte NSString, when you just leaked a 3MB UIImage? Memory Monitor can be useful in this regard, because it lets you monitor total memory usage of all apps running on the device, even the various built-in subsystems like SpringBoard, MobileSafari, and a handful of various daemons. However, it still makes finding an elusive memory leak difficult.
Enter Clang, a static analyzer that is a tremendous asset to any iPhone developer. To use Clang, you build (but not run) your app for the simulator in Debug mode, and then run a Clang analysis on the binary. It will take 15 to 20 seconds to run, at the end of which it generates an HTML file that lists all of the problems that it has found in your code, complete with line numbers and comment blocks explaining the problem. The first time you run it can be pretty shocking. Here are some example screen-shots from a sample run on an XCode iPhone SDK project. First you’ll see a summary box showing the various types of issues that were found in your code:
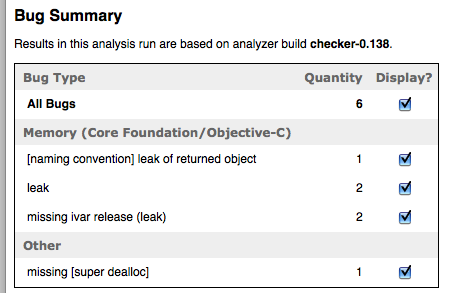
As you can see, it’s found a few leaks, and a missing super dealloc method call. If we drill into one of these, we can see some extremely detailed information about the problem:
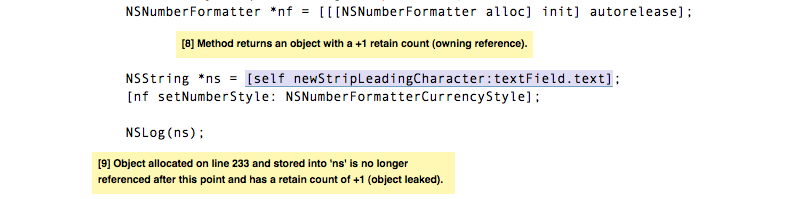
Notice that your actual code is shown, with the problem area highlighted, and comment boxes added in to describe the issue. It looks like we’ve forgotten to release the ns object here. This makes finding and resolving memory leaks much easier than trying to use Instruments to profile an app in real time. Clang will also catch leaked images, which is a huge benefit. Here’s another example of an issue found by Clang:
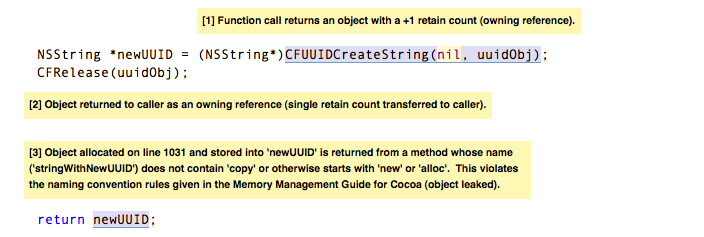
As you can see, this method returns an object with a retain count of 1, but the method name doesn’t start with “new”, “copy”, or “alloc”, and thus violates Objective-C naming conventions. This could be fixed by changing the name of the method to “newSomeMethod”, which would likely cause an leak to be flagged in the calling method, or you could autorelease the object on return, and retain it in the caller.
Where to get Clang?
You can download Clang here:
http://clang.llvm.org/StaticAnalysis.html
Using Clang
Clang is run from the command-line, so you’ll have to run it from the Terminal. After installing it, you will also probably want to add Clang to your system path. To do so, in the terminal, create a file named .bash_profile (assuming you’re using the default Bash shell), and add this line:
export PATH=/Developer/Applications/Clang:$PATH
I’ve installed Clang in /Developer/Applications/Clang. You would obviously change this to be your own install location.
To run Clang, you’ll have to restart your terminal session. You then want to build the app in XCode with the Simulator/Debug profile, and navigate to your project directory in the Terminal. Once there, you run these two commands:
rm -rf /tmp/scan-build*
rm -rf build/;scan-build –view xcodebuild
You’ll see a lot of text scroll by pretty rapidly, and when it’s finished, your browser will open up an analysis log on port 8181 (by default). Sometimes the Clang server fails to start. I don’t know why. It seems to happen to me about 25% of the time. If this happens, just repeat the process. It’ll probably work next time.